How to find large images on a website: three tools gave us three different lists
On this page
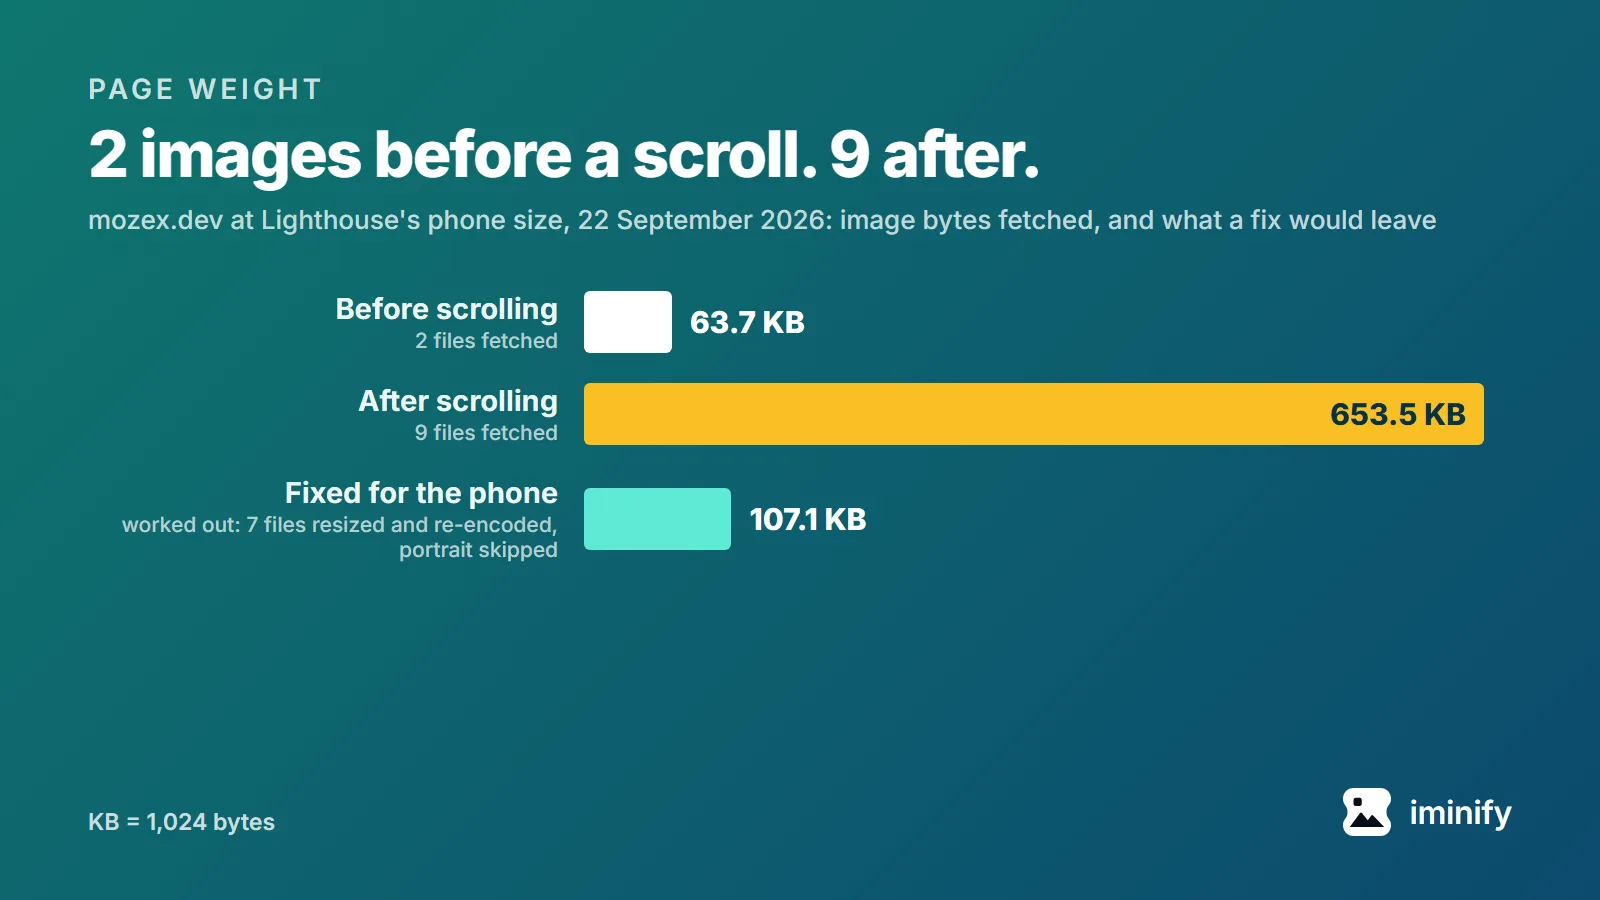
On 22 September 2026 we loaded mozex.dev, the site of Mozex Labs, which runs Iminify, at the phone size Lighthouse emulates, and listed its images three ways: Chrome's network log, Lighthouse and a console snippet. Before any scrolling, Chrome had fetched 2 image files, 63.7 KB. After we scrolled to the bottom, it had fetched 9 files, 653.5 KB. Lighthouse's phone runs requested 7 and never the two heaviest, 340.8 KB between them. The browser's own timing data put one image at 0 bytes.
So the list you can trust comes from Chrome's Network panel, taken after a scroll. Every method here works on one page at a time, so run it on the pages you care about most.
In the Network panel, scroll to the bottom before you count
In Chrome's Network panel:
- Open DevTools, then the Network tab, and click the Img filter. Under More filters, tick Hide data URLs.
- Tick Disable cache, so every image comes over the network the way a first visit gets it.
- For a phone's list, click Toggle device toolbar and pick a phone from the Dimensions menu.
- Reload the page.
- Scroll slowly to the bottom, and wait until no new rows appear.
- Click the Size column header to sort by size.
Step 5 is the one that changes the answer. We recorded the requests the Network panel lists through the DevTools protocol, with the cache off. At Lighthouse's desktop screen size, 1350 by 940, Chrome fetched 2 of the 8 image files the page loads at that size before we scrolled (122.7 KB) and all 8 after (641.3 KB).
Every image on the page but one is marked loading="lazy", and Chrome starts a lazy image's download only when it comes within a set distance of the screen. In Chrome 153 that distance is 1,250 pixels on a 4G connection and 3,000 when Chrome can't tell what connection it has. Ours reported 4G. The one lazy file it fetched sat 890 pixels below the first screen; every file it held back sat more than 1,250 below.
The Size column adds each response's headers to the file, and DevTools divides by 1,000 to make a kilobyte, so its figures run slightly above the ones in this post, which are file sizes divided by 1,024. Sorting finds the big files. Whether one is too heavy for its pixels is a separate question: Lighthouse budgets a sixth of a byte per pixel, as our post on kilobyte targets works out.
What Lighthouse's list leaves out
We ran Lighthouse 13.5.0 three times with its phone settings and three times with its desktop preset. Every phone run requested 7 image files and neither of the page's two largest, a pair of 1920-pixel dashboard screenshots. Every desktop run requested all 8. The difference from our no-scroll count comes from a command Lighthouse sends before it loads the page: Network.emulateNetworkConditions with every value at zero, which is how its default mode switches throttling off. We sent the same command to our Chrome, and without a scroll it fetched Lighthouse's lists exactly, the same 7 files on the phone and all 8 on desktop. On the phone the fetches reached about 2,900 pixels below the first screen and missed the dashboards, about 4,000 down, which fits the 3,000-pixel distance, not the 4G one.
Lighthouse's image insight, "Improve image delivery", also skips a file the phone did download. The page has a 640-pixel portrait that CSS hides on small screens, and it carries no loading="lazy", so Chrome at phone size fetches all 51.5 KB of it and shows none of it. The insight rated six of the seven files in those runs and not that one: its source drops any image that was never painted, to "filter out things like preloaded image requests where an image file is downloaded but never rendered on the page." You'll find the portrait in "Avoids enormous network payloads" instead, sixth of the ten requests that audit lists.
A console snippet that lists a page's images with their sizes
For a table you can sort and copy, paste this into the Console tab of Chrome's DevTools on the page you want to check. Until you've typed a few commands there, Chrome asks you to type allow pasting and press Enter before it accepts a paste. The snippet scrolls down one screen at a time, up to 40 screens, waits for late images, then prints the images the page fetched, largest first:
(async () => {
  for (let step = 0; step < 40; step++) {
    scrollBy(0, innerHeight);
    await new Promise((done) => setTimeout(done, 400));
    if (scrollY + innerHeight >= document.documentElement.scrollHeight) break;
  }
  await new Promise((done) => setTimeout(done, 2000));
  const images = performance.getEntriesByType('resource')
    .filter((e) => e.initiatorType === 'img' || e.contentType?.startsWith('image/'))
    .sort((a, b) => b.encodedBodySize - a.encodedBodySize);
  console.table(images.map((e) => ({ file: e.name.split('?')[0].split('/').pop(), bytes: e.encodedBodySize, from: e.initiatorType })));
  const total = images.reduce((sum, e) => sum + e.encodedBodySize, 0);
  console.log(`${images.length} images, ${total} bytes (${(total / 1024).toFixed(1)} KB)`);
})();
It reads the browser's resource timing entries, so it also catches CSS background images from the page's own domain, whose from column says css, and the favicon (2,000 bytes here). A CSS background served from another domain didn't appear at all on a local test page. On the phone view of mozex.dev it printed 10 rows, 628,920 bytes (614.2 KB), and the dashboard screenshots came out on top at 201,792 and 147,198 bytes.
One row said 0. That was a screenshot served from another domain, which Chrome's network log had at 42,278 bytes. The browser reports a file from another origin as zero bytes unless that server sends a Timing-Allow-Origin header, and this one didn't. A 0 in the table means "look it up in the Network panel", not "free". Check the Network panel on a busy page too. Chrome's resource timing buffer held 250 entries (a test page with 300 images listed 250), and every request takes one: on a page with 240 scripts, those and the favicon request took 241 entries, and the snippet listed 9 of its 30 images.
Which of these images slow the page down?
A heavy image matters most for speed when it's the page's Largest Contentful Paint element, and Lighthouse's "LCP breakdown" names that element. On all three phone runs it was the text of the logo. On desktop, two runs named the headline and the third named the portrait, which the page already requests with fetchpriority="high".
So on mozex.dev the four heaviest files were never the element Lighthouse timed. They cost the visitor data, most of it on files drawn far smaller than they are.
Whether a hidden image downloads came down to loading="lazy" on this page. The page's small avatar, hidden on wide screens, carries it and was never downloaded in any of our desktop runs, which matches web.dev's note that Chrome, Safari and Firefox don't load a lazy image hidden with display: none. Adding it to the portrait would spare the phone, but on desktop the portrait sits in the first screen, and web.dev's advice is not to lazy-load images likely to be in view when the page loads, "especially LCP images".
What fixing the phone's list is worth
The two dashboard screenshots are 1920 pixels wide and sit in a 304-pixel slot on the phone. To put a number on the waste, we took the seven files the phone shows that the site serves itself, leaving out the other-domain screenshot, and resized each to its slot times the emulated density of 1.75. Then we gave each to cwebp 1.5.0 at the lowest quality that still scores 70 on SSIMULACRA 2 (ssimulacra2 from libjxl v0.12.0), the score where "you have to hunt" for the damage. The flags are the ones our pipeline uses for lossy WebP, with -sharp_yuv on the screenshots, following the recipe in our kilobyte-targets post, and each file was scored against the served picture at its new size.
| File | Served | Bytes | Phone size | cwebp at score 70 |
|---|---|---|---|---|
| dashboard-before | 1920x1080 | 201,792 | 532x299 | 9,694 |
| dashboard-after | 1920x1080 | 147,198 | 532x299 | 8,770 |
| compressor | 1240x1067 | 72,912 | 536x461 | 10,880 |
| before-after | 880x660 | 57,690 | 536x402 | 15,520 |
| page-scan | 880x660 | 47,960 | 536x402 | 10,554 |
| pricing | 880x660 | 34,134 | 536x402 | 9,566 |
| profile-256 | 256x256 | 12,518 | 161x161 | 2,392 |
Together the seven go from 574,204 bytes to 67,376. Keep the other-domain file as it is, and if the phone also skipped the hidden portrait, its 653.5 KB of images would come to 107.1 KB. A desktop still needs larger copies than these, so a real fix serves each size through srcset and sizes. For one file at a time, our WebP compressor resizes by pixels on the way through.
A scan collects a whole page
For a whole page of your own, a scan opens it in headless Chrome and scrolls to the end. It collects every img and each size in its srcset, CSS backgrounds and images added by scripts, then lists each image with its original size, new size and saving. It skips SVG and AVIF files, and it asks a CDN for the original file rather than the WebP a CDN may convert on the fly, so an "original size" there can differ from what your page served. A scan needs a free account (3 scans a day, up to 20 images each), and its resize setting applies to every image it found. For the other widths a srcset needs, change the size and pick Recompress on a result.